Apr
5
2016 Access Publishing CEO Scott Brennan spoke today at the Wine Industry Marketing Collaboration group at Panolivo Restaurant. He gave a presentation on “An Introduction to Google Analytics.”
“It was a pleasure to meet with so many wine industry marketing coordinators,” Brennan says. “They were all engaged and interested in how to make the most of their Internet marketing. I really appreciated the opportunity.”
The group was organized by Lauren Phelps of Tablas Creek. Other industry leaders included Steffanie Anglim of Anglim Winery, Kristen Darnell of Epoch Wines, Annie Bowski of Onyx Wines, Katie Hayward of Uncorked Wine Tours, and marketing people from LeVigne, Alta Colina, and others.
Here is the slide show presentation on Google Analytics, which included a live review inside the program. For more details, or a private presentation on Google Analytics or Local Search Engine Optimization, contact speaker Scott Brennan at (805) 26-9890.
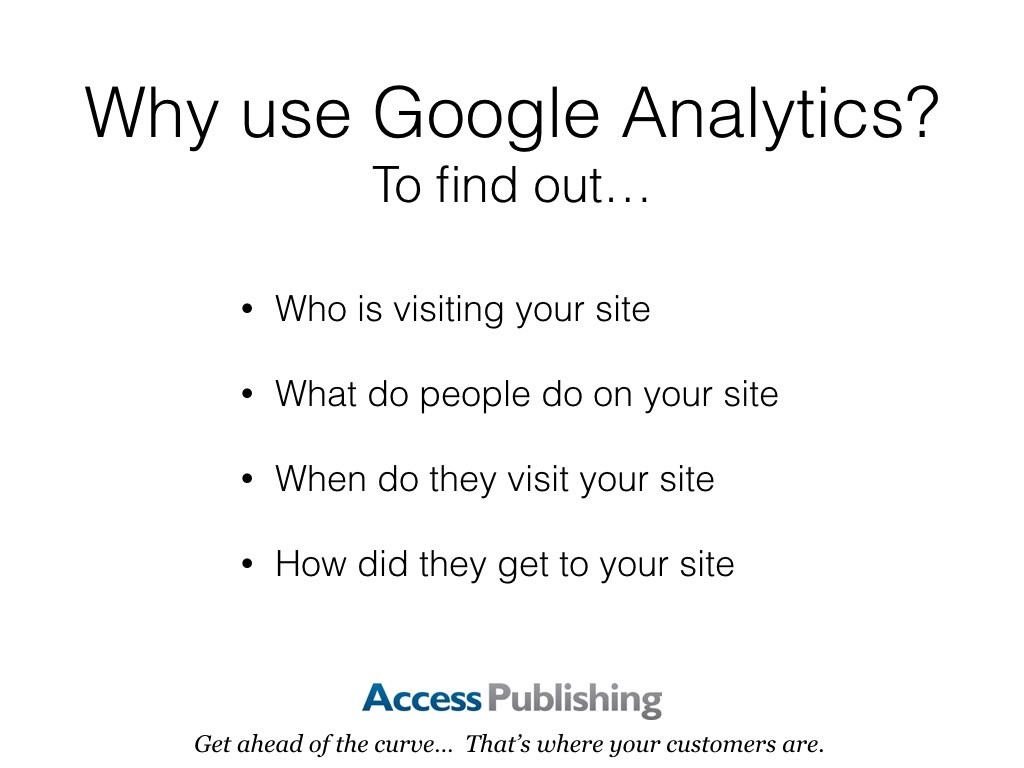
Who visits your website – user’s geographical location, which browser did they use, what is their screen resolution, which language they speak, etc.
What they do when they are on your website – you can see how long users stay on your website, what pages they are visiting the most, which page is causing the users to leave most often, how many pages an average user is viewing etc.
When they visit your site – you can see which time of the day is the hottest for your website. This helps you pick the time to publish your posts. If that time zone is not compatible, then you can schedule your posts.
Where did they arrive on your website from – you can see how the user found you. Whether it was through a search engine (Google, Bing, Yahoo etc), social networks (Facebook, Twitter etc), a link from another website, or a direct type-in. Google Analytics also shows you the breakdown of each traffic source, so you can focus on specific ones if you like.
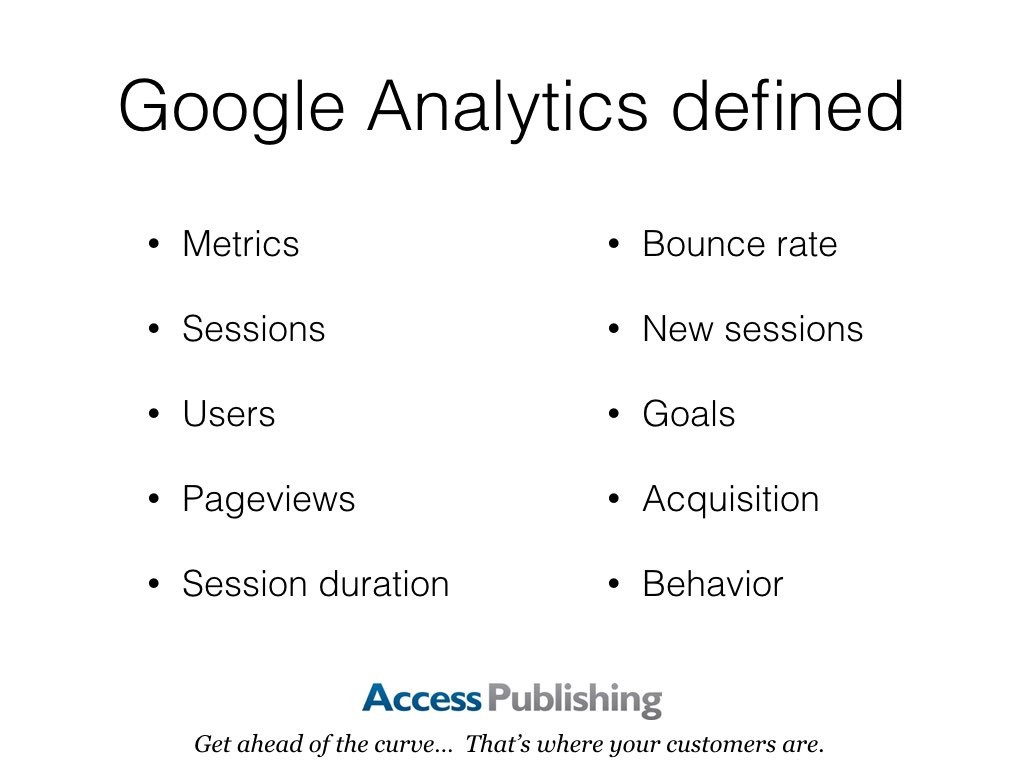
Metrics—Metrics are individual elements of a dimension that can be measured as a sum or a ratio. Screenviews, Pages/Session and Average Session Duration are examples of metrics in Google Analytics.
Sessions—A session is the period of time a user is actively engaged with your website, app, etc., within a date range. All usage data (Screenviews, Events,
Ecommerce, etc.) is associated with a session.
Users—Users who have had at least one session within the selected date range. Includes both new and returning users.
Pageviews—Pageviews means the total number of pages viewed. Repeated views of a single page are counted.
Avg. Session Duration—The average length of a session.
Bounce Rate—Bounce rate is the percentage of single-page visits (i.e., visits in which the person left your site from the entrance page without interacting with the page).
New Sessions—An estimate of the percentage of first-time visits.
Goals—Goals let you measure how often users take or complete specific actions on your website.
Conversions—Conversions are the number of times goals have been completed on your website.
Campaigns—Campaigns (also known as custom campaigns) allow you to add parameters to any URL from your website to collect more information about your referral traffic.
Acquisition—Acquisition is how you acquire users.
Behavior—Behavior data helps you improve your content.
“It was a pleasure to meet with so many wine industry marketing coordinators,” Brennan says. “They were all engaged and interested in how to make the most of their Internet marketing. I really appreciated the opportunity.”
The group was organized by Lauren Phelps of Tablas Creek. Other industry leaders included Steffanie Anglim of Anglim Winery, Kristen Darnell of Epoch Wines, Annie Bowski of Onyx Wines, Katie Hayward of Uncorked Wine Tours, and marketing people from LeVigne, Alta Colina, and others.
Here is the slide show presentation on Google Analytics, which included a live review inside the program. For more details, or a private presentation on Google Analytics or Local Search Engine Optimization, contact speaker Scott Brennan at (805) 26-9890.


Why use Google Analytics? To find out… Who is visiting your site; What do people do on your site; When do they visit your site; How did they get to your site.
Who visits your website – user’s geographical location, which browser did they use, what is their screen resolution, which language they speak, etc.
What they do when they are on your website – you can see how long users stay on your website, what pages they are visiting the most, which page is causing the users to leave most often, how many pages an average user is viewing etc.
When they visit your site – you can see which time of the day is the hottest for your website. This helps you pick the time to publish your posts. If that time zone is not compatible, then you can schedule your posts.
Where did they arrive on your website from – you can see how the user found you. Whether it was through a search engine (Google, Bing, Yahoo etc), social networks (Facebook, Twitter etc), a link from another website, or a direct type-in. Google Analytics also shows you the breakdown of each traffic source, so you can focus on specific ones if you like.

Google Analytics defined: Metrics, Sessions, Users, Pageviews, Session duration, Bounce rate, New sessions, Goals, Acquisition, Behavior.
Definitions
Metrics—Metrics are individual elements of a dimension that can be measured as a sum or a ratio. Screenviews, Pages/Session and Average Session Duration are examples of metrics in Google Analytics.
Sessions—A session is the period of time a user is actively engaged with your website, app, etc., within a date range. All usage data (Screenviews, Events,
Ecommerce, etc.) is associated with a session.
Users—Users who have had at least one session within the selected date range. Includes both new and returning users.
Pageviews—Pageviews means the total number of pages viewed. Repeated views of a single page are counted.
Avg. Session Duration—The average length of a session.
Bounce Rate—Bounce rate is the percentage of single-page visits (i.e., visits in which the person left your site from the entrance page without interacting with the page).
New Sessions—An estimate of the percentage of first-time visits.
Goals—Goals let you measure how often users take or complete specific actions on your website.
Conversions—Conversions are the number of times goals have been completed on your website.
Campaigns—Campaigns (also known as custom campaigns) allow you to add parameters to any URL from your website to collect more information about your referral traffic.
Acquisition—Acquisition is how you acquire users.
Behavior—Behavior data helps you improve your content.

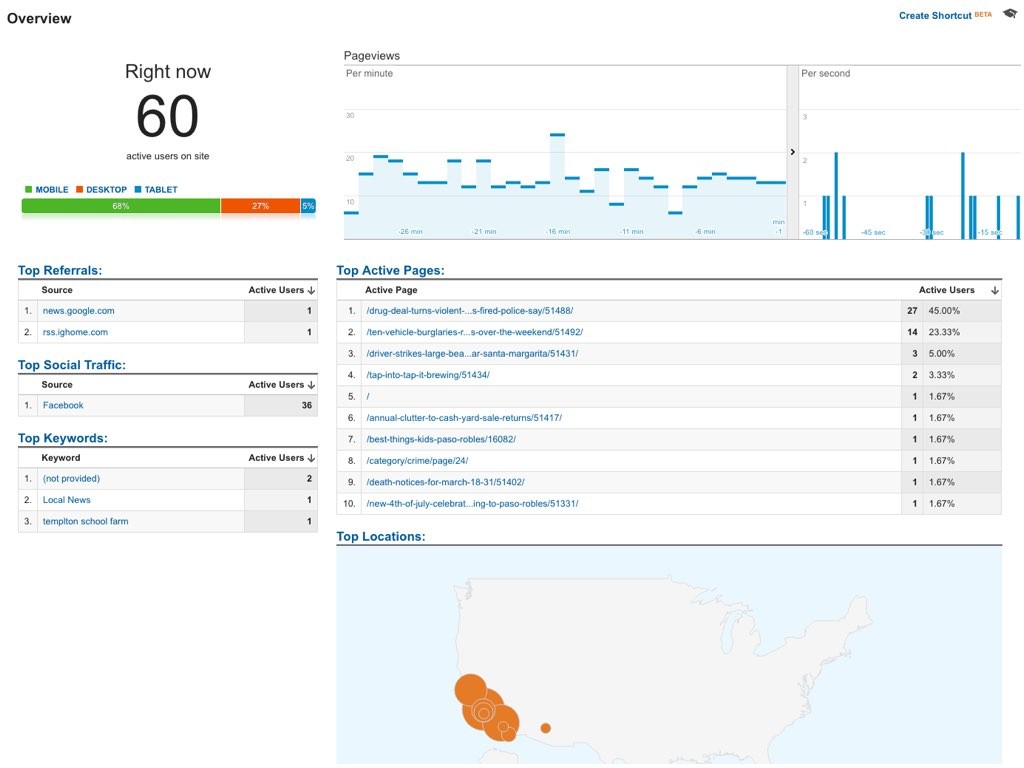
A view of Real Time Google Analytics for Paso Robles Daily News.

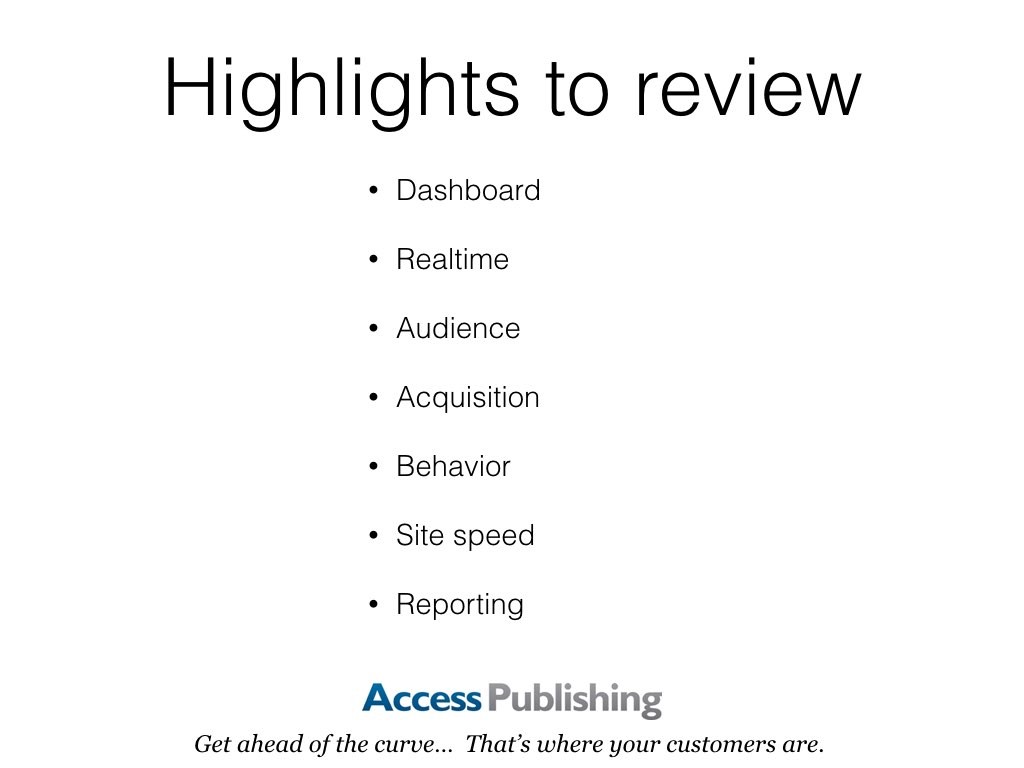
Highlights to review: Dashboard, Realtime, Audience, Acquisition, Behavior, Site speed, Reporting.

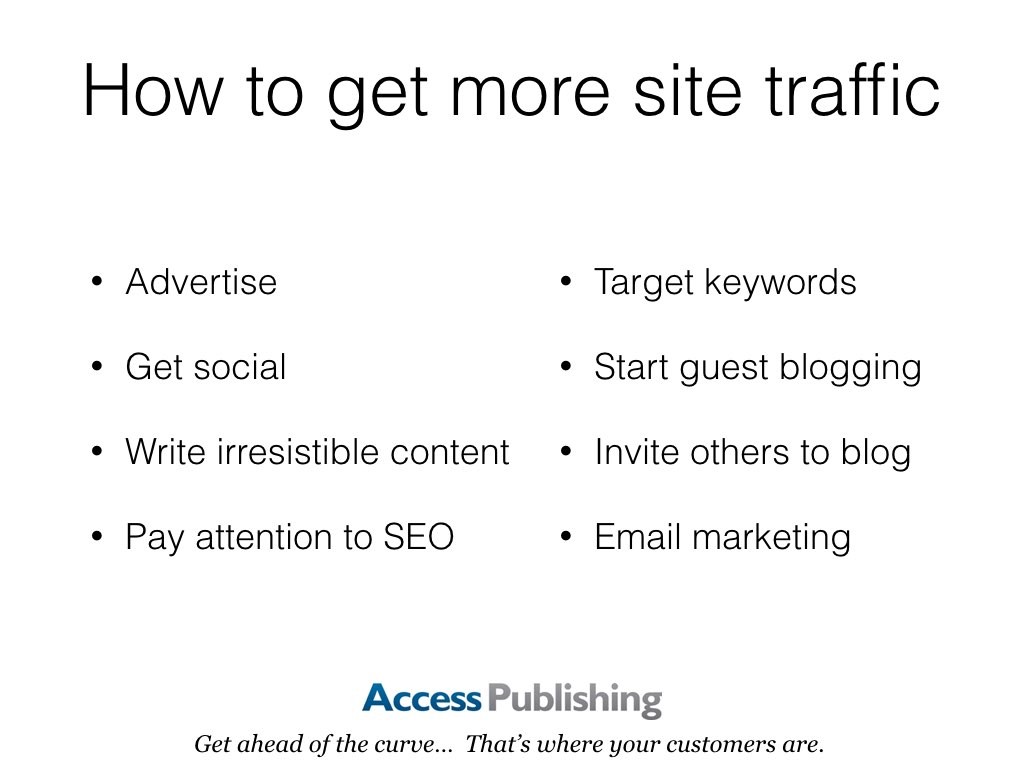
How to get more site traffic: Advertise, Get social, Write irresistible content, Pay attention to SEO, Target keywords, Start guest blogging, Invite others to blog, Email marketing.

